In this paper, a non-homogeneous gamma random process is proposed to predict capacity decay and SOH, focusing on the capacity trajectory with time or the failure time under any given capacity threshold. In this paper, the aging modeling method is combined with Monte Carlo sampling, and a method for estimating the number of cells with minimum SOH is proposed to accurately model the performance of any cell and module level battery pack. This method can be used to track the evolution of diffusion, degradation path, self heating, module and package effects of a single thin cell over time, while minimizing the calculation time. This method is especially suitable for the following aspects: (1) through the enhanced model, the influence of spreading on the performance is quantified, and the influence of stress factors on aging and spreading is considered, so as to accurately evaluate the service life of filling body; (II) design the battery pack for both the first and second service lives, as accurate models allow performance evaluation of different battery pack configurations of modules and batteries; (III) select the best balance strategy because it provides input for balanced batteries, which not only exhibit voltage imbalance at the battery and battery pack levels, but also exhibit temperature differences, which will also affect their electrochemical performance; And (IV) designing and implementing BMS strategies for heat dissipation between and within cells, which are additional temperature gradients resulting from the geometry of components and modules. Importantly, the aging modeling method we proposed can be easily implemented online to support BMS management actions and help maximize battery life. This implementation can be implemented together with an adaptive algorithm, which adjusts the gamma distribution through online SOH data, and uses machine learning algorithm to predict SOH.
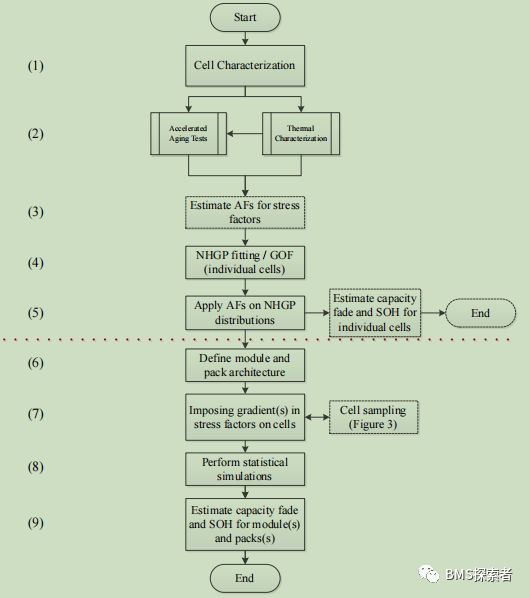
This section describes the steps of the proposed degradation modeling method, which can predict the failure time of any given capacity attenuation threshold, or the capacity attenuation of a single cell, module and battery pack. A method is also proposed to estimate the minimum number of batteries that should be monitored for capacity fading to accurately track the evolution of diffusion and battery level degradation paths to simulate the performance of modules and battery packs. Workflow for estimating the capacity decay of units, modules, and battery packs using the nhgp aging model. Figure 21 summarizes this workflow. This aging modeling method is suitable for designing new packaging configuration, BMS and battery balance strategy through simulation; It is also used to monitor SOH of batteries, modules and battery packs in operation.

Step 1. Characteristic analysis of a new cell sample. The proposed workflow first uses Coulomb counting or any other suitable method to estimate the single capacity of a new cell sample. The performance dispersion of new cells is due to their inherent differences, which is expected to be aggravated due to different stress factors during operation and static. Based on the expected diffusion level in the new cell. It is recommended that characterization be performed in at least four cells to capture cell to cell differences in BOL.
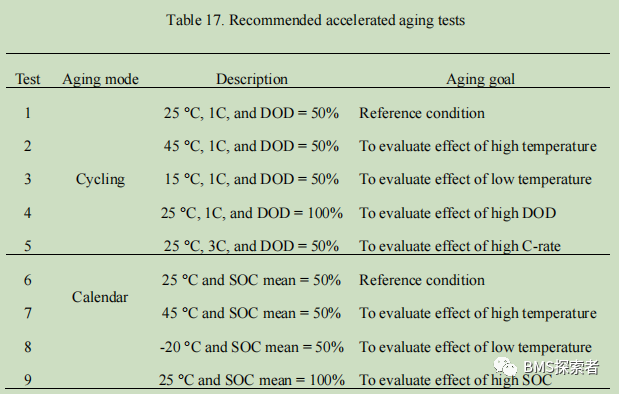
Step 2. Conduct accelerated aging test. This step requires accelerated aging testing of characteristic cells during calendar and cycle aging to evaluate the effects of temperature, SOC, DOD and current magnification. It is recommended to implement the comprehensive test matrix proposed by galatro et al. Covering a wide range of stress factors and degradation mechanisms. Table 17 shows the recommended minimum number of accelerated aging tests, where each test must be carried out in at least four cells to reasonably capture the effects of diffusion.

Step 3. Estimate the acceleration coefficient. In this step, the aging data collected from the acceleration test is used to estimate the acceleration factor to adjust the capacity attenuation value of the reference data set to any other operating conditions.
Step 4. Fit nhgp distribution map. This step applies the method described by Gupta et al., hereinafter referred to as the "baseline method", in which the three parameters in the non-homogeneous gamma distribution (a, B and C37 in the equation) are fitted to a single degradation trajectory of each unit in the reference data set by maximizing the logarithm of the likelihood function of the observed degradation increment. In addition, an nhgp was also fitted to the complete reference data set, i.e. after all observed deterioration increments of all test units were aggregated. Assuming that all cells are the same (the same manufacturer, model, chemistry and capacity), it is assumed that this overall nhgp distribution represents the expected degradation trajectory of any untested cell from the same type.
In this step, a goodness of fit (GoF) test is required to evaluate whether a measured data set follows the gamma distribution. For this task, I recommend Kolmogorov Smirnov (KS), which is applicable to several statistical distributions, including gamma process, or gamma anisotropy test.
Step 5. Apply the acceleration factor. In this step, the capacity attenuation value under the reference conditions is multiplied by the corresponding acceleration factor to adjust the degradation effect under different temperatures, nhgp and current magnification, and the acceleration factor is applied to the fitting nhgp distribution of a single cell.
Step 6. Define the battery architecture. The proposed aging model is applicable to any battery module and battery pack structure. Our aging modeling method can be applied to the whole battery pack. The method is to statistically simulate any combination of nhgp distribution (such as min () and sum ()), and apply the space-time difference of aging path and stress factor to each monomer in the battery pack.
Step 7. Apply a gradient in the stress factor. In this work, by directly applying the temperature gradient to the battery pack for modeling and simulation, the acceleration factor is used to adjust the capacity attenuation value to include their impact on the battery degradation path. In space, the thermal generation of the cell is affected by its internal characteristics, such as the change of active substance concentration and the structural difference of electrode structure, which affect the entropy heat related to the insertion / de insertion reaction. On the other hand, at the module and group level, the temperature non-uniformity between batteries affects its charge and discharge power, resulting in electrical imbalance, and ultimately reduces the performance of battery modules or groups. During the design phase of battery modules and components, these temperature gradients are obtained by simulating BMS. During operation, these values are measured directly on the battery surface through the sensor infrastructure of the components.
Step 8. Perform statistical simulation. The purpose of these simulations is to characterize the overall degradation trajectory of the battery pack, which is composed of a group of cells arranged in any parallel series connection. Statistical simulation can be performed using one of two methods. First, I can randomly assign a known (fitted) nhgp distribution (step 4) to each cell in the package and use sampling to replace sampling. Implicitly, this assumes that the cell can only have one observed degradation track, that is, the samples we obtained from the entire battery pack are representative. In addition, considering that I have obtained the nhgp distribution of the degradation increment of the entire reference data set, random samples can be taken from this distribution to generate simulated degradation trajectories consistent with the trajectories observed in the experiment, but not necessarily equal to them. This is the method I recommended in this work, although the supplementary materials have the results of statistical simulation comparing the two methods to illustrate any differences they may cause in the predicted degradation.
Step 9. Estimate capacity degradation and SOH of modules and components. The total capacity attenuation and SOH estimation of a group of cells depend on their arrangement, and there are important differences between parallel connected cell groups and series connected cell groups. For cells connected in parallel, the total capacity of the set is the sum of the individual capacities of the cells, which can be expressed as the sum of the initial capacities of the cells minus the sum of the degradation increments of each cell.


 Home
Home Products
 Telephone
 Message


